According to MarketSmith founder and legendary investor William J. O’Neil, the first step in learning how
to pick big stock market winners is to examine leaders of the past. From these observations, you will be
able to recognize the characteristics these stocks had just before their spectacular price advances.
Toward that goal, O’Neil completed a comprehensive study of the greatest winning stocks spanning the past
125 years. He then put together a set of common characteristics to these past market leaders and coined
the term CAN SLIM®. Each letter stands for one of the seven chief characteristics of
these greatest winning stocks, just before they made huge profits for their shareholders.
It’s this philosophy that helped O’Neil become the youngest person at the time to buy a seat on the New
York Stock Exchange. It’s also the same philosophy that allowed our India model portfolio return over
106% in 2013-16 vs. Nifty’s 51% gain. The reason CAN SLIM® continues to work cycle after
cycle in countries throughout the globe is that it’s based solely on the reality of how the stock market
actually works rather than personal opinions. Human nature at work in the market simply doesn’t change.
CAN SLIM® Investing System & History
Once you buy a stock, when should you sell ? Many investors simply don’t have an exit strategy – and
their returns suffer accordingly. But you can use time-proven sell rules to make a huge difference in
your portfolio.
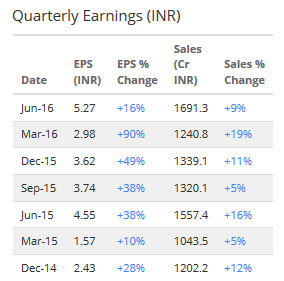
Look for stocks with big earnings in their latest reported period. The bigger, the better.
Growth of at least 25% is a good starting point. You would also like to see earnings
acceleration over the last three periods. For example, one period earnings may be up 25%,
the next up 50%, and the most recent up 90%.
Earnings Growth is an important factor to look at when buying stocks. Look for stocks with
increases in current quarterly earnings of at least 25%.
Interim earnings are located in the Details tab within Quarterly Earnings.
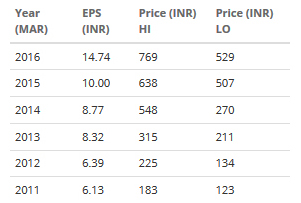
You want to see annual earnings growth of at least 25% for each of the last 3 years. We have
also found that the greatest stocks of all time had the best margins in their industry group
and return on equity of more than 17%.
In addition to quarterly earnings you want to make sure companies are showing strong long
term growth. Look for companies that have grown their earnings at least 25% or more for the
past 3 years.
Annual earnings are located in the Details tab within Yearly Earnings.
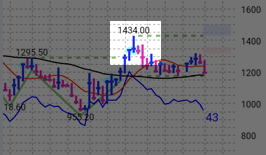
The biggest CAN SLIM® winners had something NEW! New products, new services,
new leadership, new price high or a new condition in the industry. Another important factor
is to look for newer companies. Our studies of the greatest stock market winners showed that
75% of them went public within the last 8 years.
Studies of the great stock market winners of the past all had something NEW. Always look for
companies with new, game-changing products and services.
New High is indicated by the Off High value on the iPad chart.
One of the most basic economic principles is the law of supply and demand which is most
sharply demonstrated in the stock market. Strong demand for a limited supply of available
shares will push a stock price up. On the flip side, an oversupply of shares and weak demand
will cause the price to sag.
S is for Supply and Demand. As more investors demand a limited supply of shares, a stock’s
price goes up. Look for heavy-volume accumulation by institutional investors, particularly
at key moments like when the stock is breaking above prior resistance levels.
Our Accummulation/Distribution Rating is an indicator of demand or supply of a
stock.
True leaders are those companies showing the best earnings growth, strongest sales, superior
price performance and are in LEADING industry groups. Consider buying high, and selling
higher. The results from our study of the greatest market winners revealed something quite
interesting in effect, the ‘strong got stronger.’ The task for astute investors is to locate
these strong, leading companies and avoid the weak, laggard performers.
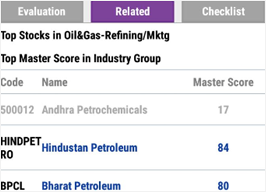
We are always looking to buy leading stocks in leading industry groups. Look for the best of
the best – the leaders in strong industries that are showing superior earnings growth and
sales.
A stock’s ranking within its Industry Group is available in the Related tab.
Mutual funds, banks, and other professional investors are the big players that drive the
market. For a stock to be a top performer, it must have institutional support to fuel its
price moves. Monitor movements in heavy volume for signs that institutional investors are
accumulating stocks.
Professional investors, like mutual funds and pension funds, propel a stock’s upward
movement. Using MarketSmith India, you will learn how to follow the big money.
Our Accummulation/Distribution Rating is an indicator of institutional
sponsorship.
Our study shows 3 out of 4 stocks follow the market’s trend, so you always want to trade in
sync with the market. You should only be buying stocks in a confirmed uptrend and protect
your capital in a correction.
Our current market status is indicated within Market Outlook.
The CAN SLIM® Investing System has its roots in a landmark study William J. O’Neil
launched as a young stockbroker in the late 1950s. He wanted to know what characteristics separate the
best performing stocks from the average stocks. What signs do they flash in the early stages of their
massive price moves? And just as importantly, as they eventually run out of steam, what sell signals do
they display that show it is time to lock in your profits?
To find the answers, he began studying the best stocks of all time, analyzing every available
performance metric. That research continues to this day, and now covers every market cycle and
top-performing stock since 1880.
O’Neil found that year after year, decade after decade, the best stocks display seven common traits just
before they make their biggest gains. Each letter in the CAN SLIM® Investing System
stands for one of those seven traits, and they form the basis of the buy rules you will find in How to
Buy Stocks.
Whether it is Bajaj Finance, Eicher Motors or Page Industries, the best stocks tend to share these same
seven characteristics at the start of their huge price moves.
O’Neil also studied what happens to leading stocks after they have had a big run. Just as they share
certain traits before they jump higher, they also exhibit similar warning signs as they peak and begin
to decline. Those signals form the basis of the sell rules you will find in How to Sell Stocks.
With stock market history on his side, O’Neil used the CAN SLIM® Investing System to
achieve remarkable investing success and become the youngest person at the time to buy a seat on the New
York Stock Exchange. And in the decades since, countless other investors – from all walks of life – have
also used the CAN SLIM® approach to achieve lifelong money-making skills and financial
security.
It all starts with getting to know the seven traits of winning stocks.
25% or higher earnings-per-share (EPS) growth in most recent quarter
Preferably accelerating EPS growth (i.e., rising quarter over quarter)
Why It’s Important
It is no coincidence that the first two letters of the CAN SLIM® Investing System both
relate to earnings growth – the No.1 factor to consider when deciding what stocks to buy.
Big, accelerating earnings-per-share (EPS) growth is what attracts the attention of the large
institutional investors. So start your search for market winners by looking for stocks with strong
quarterly and annual earnings growth – the “C” and “A” in CAN SLIM®.
Understand that 25% quarterly EPS growth is the minimum benchmark. The very best stocks will typically
have gains of 50% to 100% or more. The bigger the better, so focus on companies with market-leading,
explosive earnings growth.
What Else You Should Know
Make sure the company is strong in terms of the ingredients that generate powerful earnings growth. If
the company is weak in these areas, it may not be able to sustain long-term EPS gains.
Sales Growth: Look for 20% – 25% or higher growth in the most recent quarter. If the
company’s sales growth is below that benchmark, make sure it has at least increased in recent quarters.
Return on Equity: Look for 17% or higher ROE. Return on equity reveals how well a
company manages its capital and helps you identify the best-run businesses.
Where to Find it
You’ll find a stock’s current quarterly earnings growth, sales growth, return on equity, EPS Rating and
more in the MarketSmith India app.
MarketSmith India Properietary Rating:
EPS Rating: Ranks each stock from 99 (best) to 1 (worst) in terms of both current
quarterly and annual earnings growth. The best stocks typically have an EPS Rating of 95 or higher,
meaning they’re in the top 5% of all stocks in terms of earnings-per-share growth.
25% – 50% or higher annual earnings growth over the last three years
Why It’s Important
A company can cut costs or take other measures to boost earnings for a quarter or two. That can mask more
serious underlying problems the company may be facing in terms of demand for its products, declining
profit margins or negative industry trends. So make sure longer-term that annual earnings growth is also
strong.
Here again, the 25% annual EPS growth is the minimum. The top stocks will often post even stronger
increases. For example, Google’s three-year annual earnings-per-share growth rate was 293% before it
launched a five fold gain starting in 2004.
Where to Find It
You’ll find pass or fail ratings for a stock’s annual earnings growth and more on MarketSmith India.
MarketSmith India Properietary Rating:
EPS Rating: Ranks each stock from 99 (best) to 1 (worst) in terms of both current
quarterly and annual earnings growth. The best stocks typically have an EPS Rating of 95 or higher,
meaning they’re in the top 5% of all stocks in terms of earnings-per-share growth.
New product or service that is leading or changing the industry and generating exceptional sales and
earnings growth.
New CEO or new industry trend that benefits the company.
New price high of stock.
Why It’s Important
It takes something new to produce a startling advance in the price of a stock. It can be an important new
product or service that sells rapidly and causes earnings to accelerate faster than previous rates of
increase Or it can be change of management that brings new vigor, new ideas, or at least a new broom to
sweep everything clean. New industry conditions such as supply shortages, price increases, or the
introduction of revolutionary technologies can also have a positive effect on most stocks in an industry
group.
Bottom line: Strong earnings growth (the C and A in the CAN SLIM®
System) is the #1 factor to look for in a stock, and it’s the N in the CAN SLIM® system
(the new product or service, etc) that ultimately generates that stellar profitability.
Look for heavy-volume accumulation (buying) by institutional investors, particularly at key moments like
when the stock is forming and breaking out of a chart pattern.
Why It’s Important
The law of supply and demand is on display every day in the stock market. Strong demand for a limited
supply of available shares will push a stock’s price up. And an oversupply of shares and weak demand
will cause the price to sag. So how do you measure demand in a stock? Start by checking the average
daily trading volume. Look for days where the number of shares traded is much higher (or lower) than
normal.
If the share price rises sharply and the trading volume spikes well above average, that indicates demand.
It means mutual fund managers and other institutional investors are aggressively buying shares. And it’s
that strong institutional demand that fuels a stock’s big price move.
Where to Find It
In MarketSmith India, you’ll find pass or fail ratings for all the key Supply and Demand related
criteria.
MarketSmith India Charts: Once you know how to tread stock charts, you’ll be able to
quickly see if demand is strong or weak by checking the price volume action.
MarketSmith India Properietary Rating:
Accumulation/Distribution Rating: Measures institutional buying and selling over the
last 13 weeks, with ratings ranging from A (heavy buying) to E (heavy selling).
Top-rated stocks within top 40-50 industry groups.
80 or higher Relative Price Strength (RS) Rating.
Rising relative strength line, preferably near new 52-week high.
Why It’s Important
In the stock market, everything is relative. Institutional investors aren’t just looking for good stocks.
They’re looking for the best of the best – those with the most explosive earnings and sales growth and
the strongest game-changing new products.
Whether it’s Bajaj Finance, Eicher Motors, or Page Industries, the biggest market winners tend to be the
fastest-growing leaders in a strong and rising industry.
Fund managers tend to move their money into those types of companies, and their buying power is what
pushes the share price sharply higher. In other words, when the C, A and N in the CAN
SLIM® system (big earnings growth and a hot new product) come together, it’s like a
magnet, attracting the attention of institutional investors. That triggers the Supply and Demand – the S
in the CAN SLIM® system – that propels the stock higher, making it both an industry and
market leader and earning it the L in the CAN SLIM® system.
Where to Find It
You’ll find pass or fail ratings for industry group ranking, RS Rating and related criteria in
MarketSmith India.
MarketSmith India Charts: You can easily see if the Relative Strength line is trending
higher or lower, and if it’s nearing new high ground. An upward RS line means the stock is outperforming
the benchmark index, Sensex or Nifty 50.
MarketSmith India Properietary Rating:
Price Strength or Relative Strength Rating: Measures a stock’s price performance over
the last 12 months and then compares that result to all other stocks. Ranges from 99 (best) to 1
(worst). An RS Rating of 95 means the stock is outperforming 95% of all stocks in terms of price
performance.
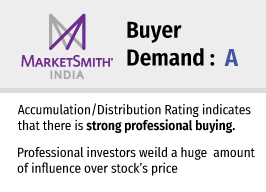
Buyer Demand or Accumulation/Distribution Rating: Measures institutional buying and
selling over the last 13 weeks, with ratings ranging from A (heavy buying) to E (heavy selling).
Increase in number of funds owning the stock in recent quarters.
Ownership by funds that have outperformed the market over the last 3 years.
Why It’s Important
“Institutional sponsorship” simply refers to ownership of a stock by mutual funds, banks, pension funds
and other large institutions. These professional investors have teams of analysts researching thousands
of stocks, so it is good confirmation to see them buying a stock you are considering. It is even better
to see the number of funds rising quarter over quarter, since it indicates increasing demand for the
stock.
Where to Find It
You will find pass or fail ratings for buyer demand, industry group ranking, relative strength rating and
related criteria in MarketSmith India.
MarketSmith India Properietary Rating:
Buyer Demand or Accumulation/Distribution Rating: Measures institutional buying and
selling over the last 13 weeks, with ratings ranging from A (heavy buying) to E (heavy selling).
What Else You Should Know
It Takes Time for Funds to Establish a Position
Since they are often managing huge portfolios, fund managers tend to take large positions in a stock.
That could mean the fund needs to buy lakhs of shares in that one stock to become fully invested. If
they tried to purchase all those shares in one day, their own buying would drive the share price up
beyond what they are willing to pay.
So it will often take weeks, even months, for an institutional investor to establish a full position and
that is just one fund. If hundreds of funds are buying that stock, do the math! It could take many
months or longer before the buying starts to ease up. That gives you the opportunity to ride their
coattails and get into the same stocks, as large institutional investors continue to buy and push the
share price higher.
Focus on More “Liquid” Stocks
Stocks with monthly trading value of less than INR 5 lacs or trading volume of less than 50,000 that
trade, are considered “thinly traded” by SEBI. Institutional investors place even higher criteria for
liquidity and tend to avoid illiquid stocks since it is harder for them to establish a meaningful
position, and it is harder for them to get in and out of the stock without pushing the price too high or
too low.
Thinly traded stocks can also be more volatile than larger, “liquid stocks (those with high daily
trading volumes). That’s because it takes less trading to dramatically move the price of a stock that
trades 1 lakh shares a day than one that trades 10 lakh shares.
So as a general rule, avoid thinly traded names and focus on the same liquid stocks the institutional
investors are buying.
Take defensive action as the market begins to weaken
Why It’s Important
Talk about last, but not least! In many ways, the M in the CAN SLIM® System – market
direction – is the most important.
You can have all the other six traits lined up, but if the overall market is in a downtrend, it will be
very hard for even the best stocks to move higher. That’s because 3 of 4 stocks move in the same
direction as the general market, either up or down.
(The “general market” refers to the major indexes, primarily the Nifty 50 or the BSE Sensex.)
Simply put: If you buy a stock when the market is in a strong uptrend, you have a 75%
chance of being right. But if you buy when the market is in a downtrend, you have a 75% chance of being
wrong.
MarketSmith India makes it easy to keep the odds in your favour.
Each day, the Market Pulse inside The Big Picture shows you which of four possible stages the
market is in:
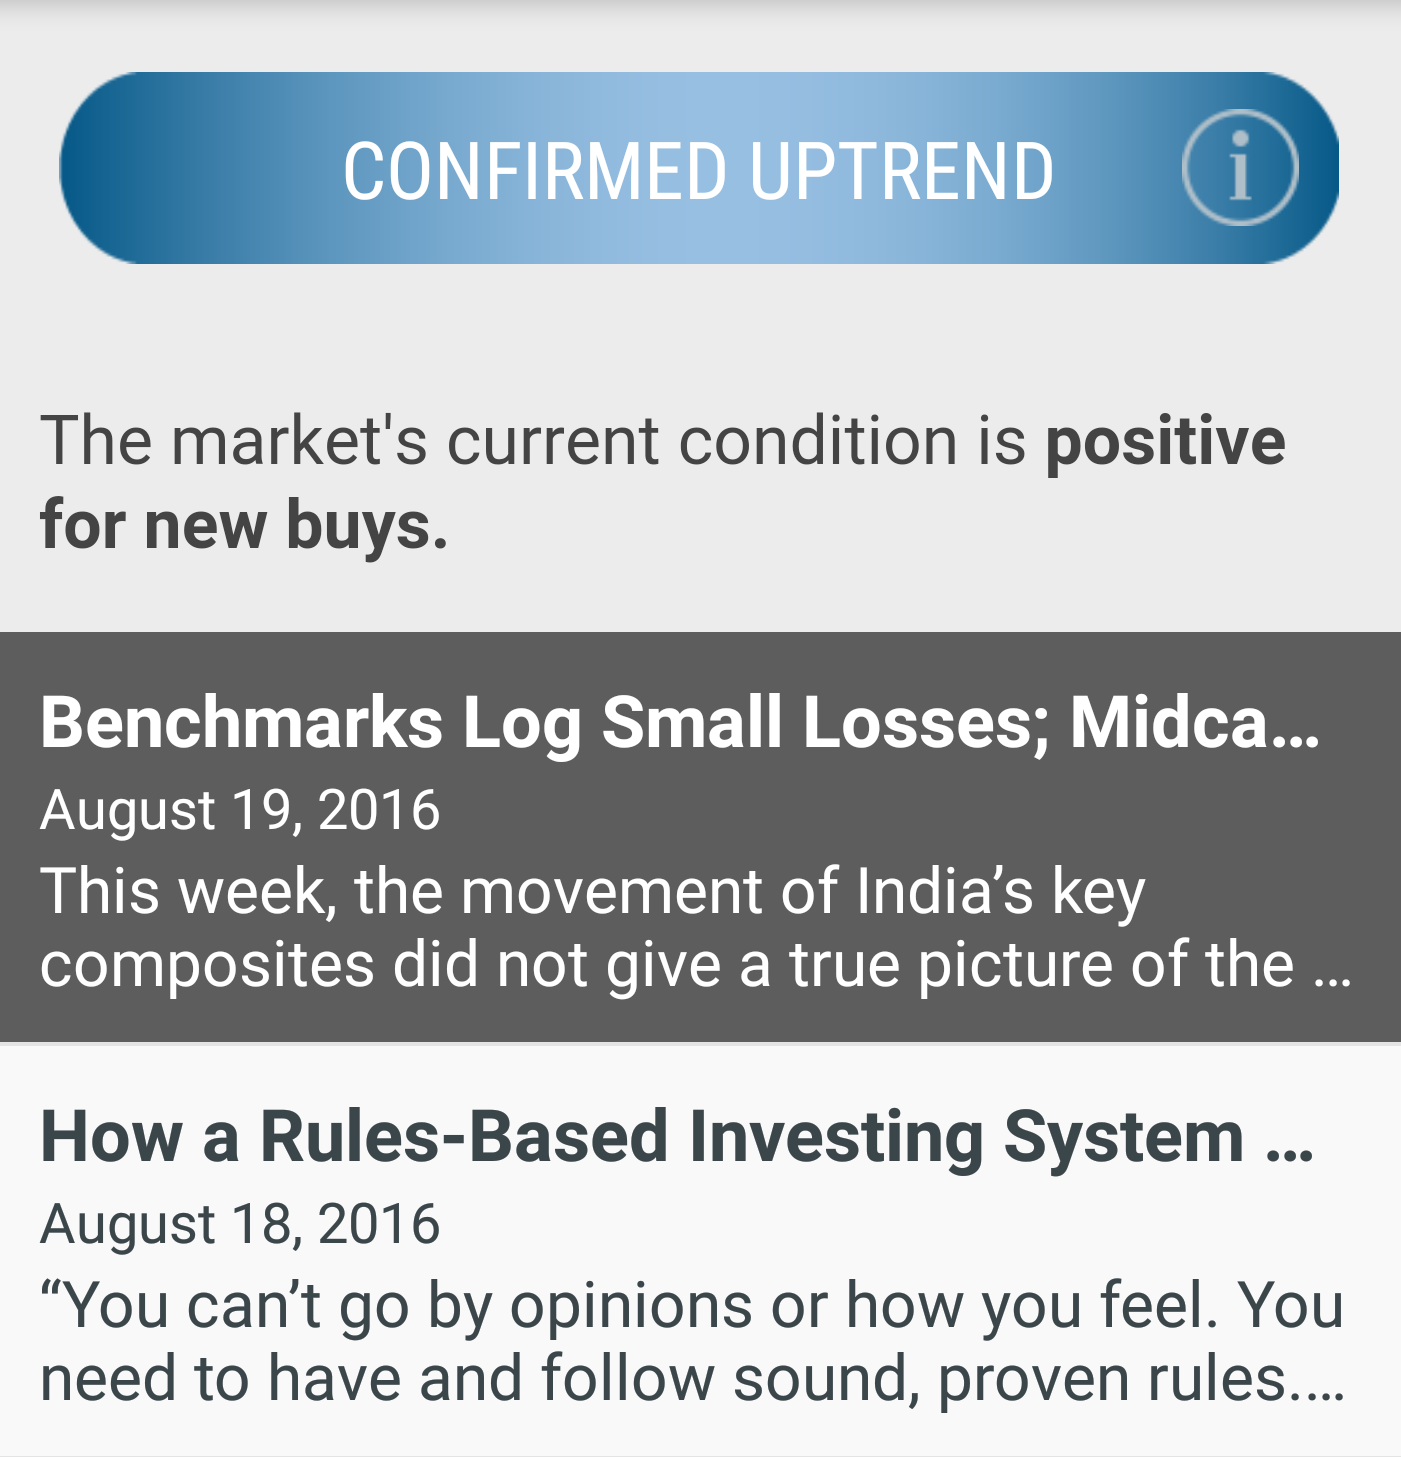
Confirmed Uptrend: This is a good time to buy fundamentally strong stocks coming out of
proper chart bases.
Uptrend Under Pressure: This is a time to be cautious with new buys and keep a close eye
on your current holdings to make sure they are acting well. You may also consider locking in gains.
Downtrend: Making new buys in a downtrend is riskier, since most stocks will follow the
market’s downward trend. Be sure to keep a close eye on your portfolio to make sure you are protecting
your gains and cutting losses quickly. Use this time to look for stocks to add to your watch list so you
will be ready to take action when the market starts a new uptrend.
Rally Attempt: Play the waiting game until you see a follow-through day or strong
action in leading stocks.
You will find that year after year, winning stocks launch their big advances at the start of a new market
uptrend and begin to come back down as that market uptrend starts to fade. To make – and keep – solid
stock market profits, it is important to read The Big Picture regularly and stay in sync with the market
cycle.
Where to Find It
Check the Market Direction on the home screen of the MarketSmith India app. Be sure to also read The Big
Picture (daily and weekly market commentaries) for additional insight into how to handle the current
market environment.
What Else You Should Know
You Do Not Need to Always Be Fully Invested in the Market
Your goal is to make money when the market is trending higher and to protect your profits when it starts
heading lower.
That may sound obvious, but many people pay no attention to overall market direction. They jump in
anytime and just blindly “buy and hold”. Investors with that strategy may make money during an uptrend,
but they often give it all back – and then some – when a downtrend hits.
So understand there is a good time and a bad time to buy stocks. Knowing the difference is the key to
growing – and protecting – your stock market profits”.