As a stock gains over the course of its price run, it may periodically pull back to form areas of price consolidations – also known as bases and chart patterns.
That happens as some large investors sell shares, taking profits after a run-up.
Each base is important to watch for since it’s where the stock typically takes a “breather” before resuming its climb, using the base as a springboard to climb higher as it resumes its journey up the chart.
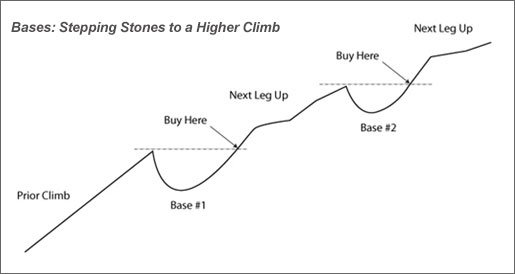
Bases are precursors to a winning stock’s next big move. They’re like stepping stones – resting areas where the stock pauses after climbing higher for a few weeks or months. The base is an opportunity for the stock to regain its strength and launch the next stage of its climb.
Below is a simplified version of what that looks like.
Use Bases to Reduce Risk, Reap Rewards
Bases and their related buy points help you identify the best time to get into a stock. Think of a chart pattern like a launching pad, It’s the starting point for the stock’s next big move up. The stock shakes off a prior decline, finds a “floor” of support, then punches through its former “ceiling” of resistance. That’s a sign of strength and an indication that a new upward climb has begun. By waiting for that to happen before you buy, you reduce your risk and still leave plenty of potential for big profits.
Here’s how that works.
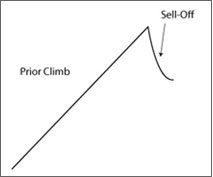
Left Side of Base: The Sell-Off
Bases begin after the stock has been climbing higher for a while (typically a few weeks or months), then begins to decline. That usually means some fund managers and other institutional investors are cashing in the profits they made in the prior run-up. It often happens as the general market starts to slip into a downtrend. The sell-off creates the left side of the pattern.
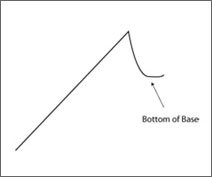
Bottom of Base: A “Floor” of Support Forms as Selling Subsides
The bleeding stops and a bottom begins to form once large investors stop selling aggressively and begin buying shares again. But at this point, it’s too early to tell if the stock has truly regained its strength or will continue to head lower.
Right Side of Base: Institutional Buying Returns
The right side of a pattern forms when large investors start scooping up shares again. That pushes the stock higher and gets it closer to the next crucial test area, the ideal buy point or prior area of resistance. But stay patient and don’t predict what will happen next. Make the stock prove its mettle by breaking past its buy point on heavy volume.
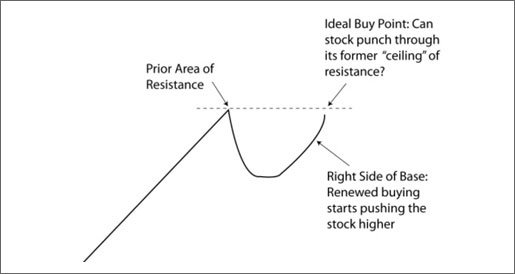
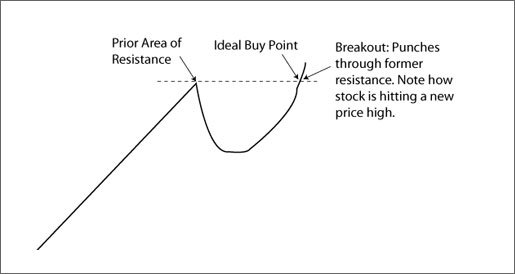
Buy Point: Breaks Through Former “Ceiling” of Resistance
The ideal buy point in a chart pattern is based on the prior area of resistance. Make sure the stock can punch through that ceiling on heavy volume before you invest. That significantly reduces your risk and still leaves plenty of opportunity for big gains.
Look for New Highs
As we saw earlier, the N in CAN SLIM® stands for a “new” product or industry trend, but it also refers to a new 52-week price high.
For each of the telltale patterns – cup-with-handle, double bottom and flat base – a key requirement is that the stock be at or near a new high as it breaks out (Look at the example of a Buy Point, above. Note how the buy point and breakout are in new high territory). That’s a sign of strength and an important reminder of this historical market fact:
- Stocks hitting new price highs tend to go higher.
- Stocks hitting new price lows tend to go lower.
So avoid stocks trending down and hitting new lows. Instead, focus on stocks showing strength as they climb into new high ground and break out of a sound chart pattern.
Why Not Buy at the Bottom of the Base?
Hindsight is indeed 20-20. After a stock has completed the pattern, it’s easy to retroactively say you would have made more money by buying at the bottom of the base. But when the pattern is still forming, it’s too early to tell if the trend has truly changed, or if the stock will continue to head even lower. If you try to buy before the pattern is complete, you’re just taking on unnecessary risk.
Instead, wait for the stock to finish the base and break out on heavy volume. That dramatically reduces your risk and still leaves plenty of potential for major gains.
Managing Expectations
Successful investing starts with keeping the odds in your favor. Year after year, history shows the best way to do that is to buy stocks with strong fundamentals as they break out of a proper chart pattern during a market uptrend. That helps significantly reduce your risk and increase your profits.
But another key to successful investing is to manage your expectations. Understand that not all bases lead to big gains. Sometimes a stock will break out, then reverse course and head lower again. That’s why you must always follow sound sell rules if a trade does not work out as planned. Staying disciplined is the key to long-term success, Use chart patterns to buy at the right time and also have defensive rules to both lock in profits and protect your portfolio.
Market Cycles and Bases
To understand when and why bases occur and how to profit from them, you need to recognize how closely they’re tied to the cycles of the general market.
-
-
Most Bases Form During a Market Correction
-
As we saw in the section on Market Direction, when the overall market falls into a correction, it takes 3 out of 4 stocks down with it. So when an uptrend rolls over into a downtrend, that’s when most stocks pull back to form a new base.
Tip: Most stocks begin forming a new base after rising 20% to 25% from the buy point in the prior pattern. And that typically happens around the same time the general market uptrend begins to slip into a correction. That’s why following the 20% to 25% sell rule can help you lock in your profits before the stock begins to sell off and form a new chart pattern.
-
-
Bases Mirror the Depth and Length of the General Market Downtrend
-
If the overall market correction is short and shallow, you’ll see a lot of similarly short and shallow bases among leading stocks. During intermediate declines in the general market, growth stocks often form cup bases that correct 1 ½ to 2 ½ times the market averages. And in a more severe correction that is long and deep, the patterns individual stocks form will mirror that action.
So it’s not unusual to see a stock build a long and deep base in a steep market correction. But if a stock forms a long and deep base during a much milder, overall market downturn, beware. That usually indicates something is wrong with the stock itself, and the selling is not just a normal reaction to weakness in the overall market.
-
-
The Best Stocks Break Out of Bases at the Start of a New Market Uptrend
-
When the market rebounds, the cycle begins all over again, Stocks break out of the bases they formed during the past correction and move higher.
-
-
To Buy Stocks at the Right Time, Stay in Sync with the Market Cycle
-
The big money is made in the early stages of a new uptrend. And to capture those gains, you need to do your homework during a correction and identify stocks forming the telltale bases that precede a new price move.
How to Count Bases & Why You Should
It’s a good idea to track the number of bases a stock has formed during its current run-up. As a rule of thumb, try to buy stocks that are breaking out of the first or second base of their run. Late-stage bases are riskier. Late-stage means a base that’s No. 3 or higher in the base count.
Why is it important to spot a late-stage base?
After forming a third or a fourth base, most growth stocks can’t rally much further, if at all. What usually follows is a long, steep slide. After a stock has had a large advance without a major correction, the probabilities are greater that institutional investors will cash in their profits and push the price into a serious decline.
By the time a stock forms a late-stage base it’s usually widely known to investors and running short on fresh buyers. In addition, the late-stage base tends to have unsteady price swings, bouts of strong selling or other flaws. It’s the chart’s way of telling you that the best buying opportunities are gone.
Late-stage patterns can work and sometimes do lead to nice gains, but you should understand that they involve more risk. If you buy a stock on a late-stage breakout, be sure to cut your losses quickly if the stock fails to gain traction and begins to head south.
Counting bases is not difficult, and with a little practice, you’ll get the hang of it.
To count how many bases a stock has formed, take a look at its weekly chart:
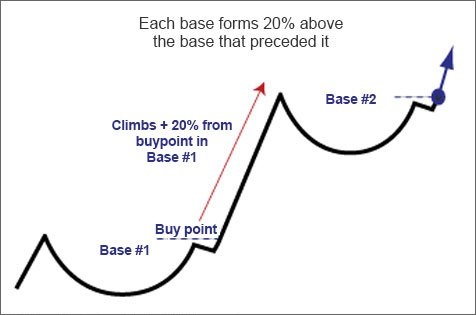
Generally do not count bases for stocks until company quarterly earnings and sales start growing by at least 25%.Each base should form at least 20% above the buy point of the base that preceded it.
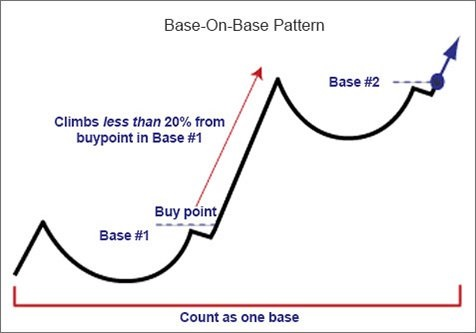
If a stock advances less than 20%, then forms another base, it’s all counted as one consolidation called a base-on-base. The buy point is figured from the current, most recent pattern.
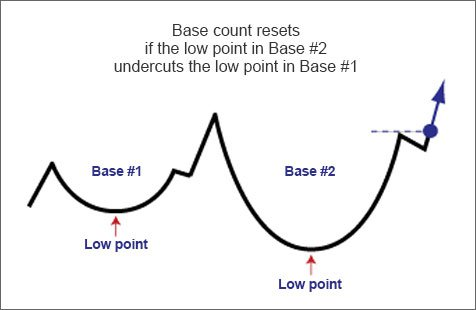
Bear markets reset the base count back to zero for all stocks, clearing the path for a new bull market, with fresh leadership. So start the count with the first break out from a base after a bear market has ended.
A stock will also reset its base count if its price drops so deep that it undercuts the lowest point in the base that preceded it.