
The concepts of support and resistance are undoubtedly two of the major aspects of technical analysis. Learning to identify these levels makes it easier to decide when you should enter and exit a stock.
Support is a price level where the stock tends to find support when it’s declining. In theory, it’s a price level where demand (buying power) is strong enough to prevent the price from declining further. This means the price is likelier to bounce off this level rather than break below it. However, once the price has gone through this level, it is likely to continue dropping until it finds another support level.
Resistance is the opposite of a support price level. It is where the stock price tends to find resistance as it is going up. This is the price level at which supply (selling power) is strong enough to prevent the price from rising further. It’s likelier for the stock not to break through this resistance level. However, once the price has passed this level, by a notable amount, it is likely that it will continue higher until a new level of resistance is hit.
The same basic factors help you decide whether to sell or hold. For example, if a stock finds support at a key benchmark, such as the 10-week moving average line, you may choose to sit tight. But if it crashes through that floor of support on heavy volume, it may be signalling that the stock could correct.
Don’t Forget the Volume
Watching the volume provides important clues about whether institutional investors are stepping in to support their positions or just dumping shares to get out as quickly as they can.
So as you go through the following examples, pay close attention to where trading gets unusually heavy or unusually light.
Support or Resistance at 50-Day or 10-Week Moving Average Line
It’s very important to watch how your stock behaves around the moving average lines – particularly the 50-day line on a daily chart and the 10-week line on the weekly chart.
The reason is simple: Professional investors use these lines as key benchmarks. So you can see if fund managers and other big players are supporting or selling the stock by watching how it behaves around those key moving average lines.
Support: If institutional investors still have a positive outlook on the stock, they’ll often step in to buy more shares and protect their positions when the stock pulls back to or dips below the moving average line. In that scenario, you’ll typically see the stock pull back to the 50-day or 10-week line on light volume (showing that institutions are not selling aggressively), then bounce back above that line on heavy volume (showing that fund managers are stepping in to buy more shares).
Sell-off: If the stock fails to find support at the benchmark lines and breaks below them on heavy volume, what does that tell you? It tells us that big investors may now be less interested in shoring up their positions and more interested in just getting out of the stock. Again, the key is to watch the volume: If trading is particularly heavy as the stock breaks through the moving average line, that’s a definite warning sign. If volume is light, it could mean the selling is less serious.
Here is an example of how Whirlpool found support at the 10 week moving average line:
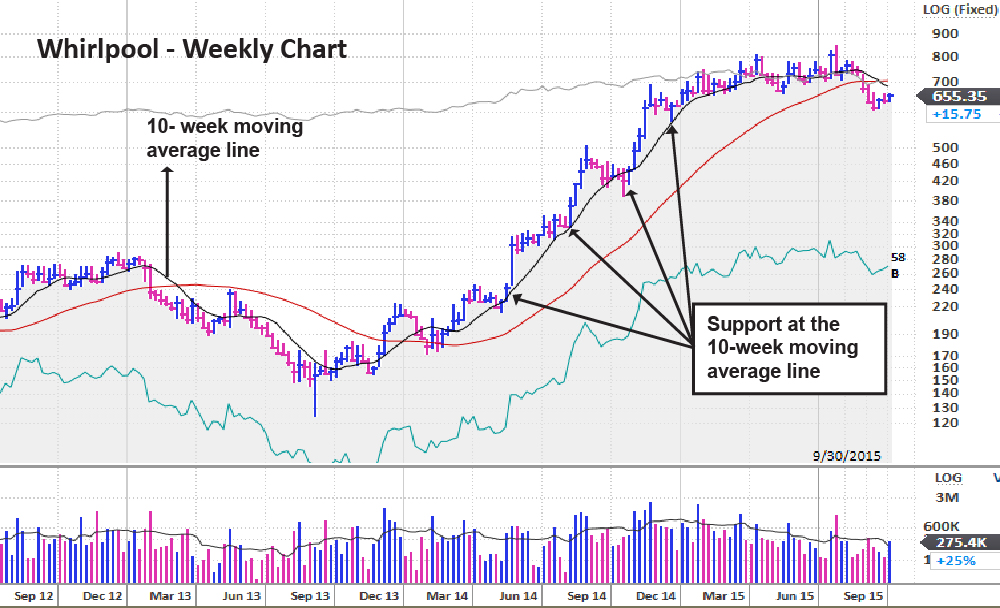
1. Support at 10-week line: On the multiple occasions where Whirlpool pulled back to the 10-week moving average line (and 50-day line on a daily chart), it generally found support and stayed above it. On some occasions, the stock dipped below the 10-week line during the week, but managed to bounce back and close above that benchmark line by Friday’s closing bell. That’s a clear sign institutional investors are stepping in to support the stock and protect their positions. Watching for that support can help you sit through normal pullbacks and hold on for even bigger gains.
Sell-Off at 10-Week Moving Average Line
Watch out when a stock crashes through and closes sharply below the 10-week line on heavy volume. It could mark a change in trend and mean even more selling is on the way.
Let’s take a look at the daily chart for Symphony:
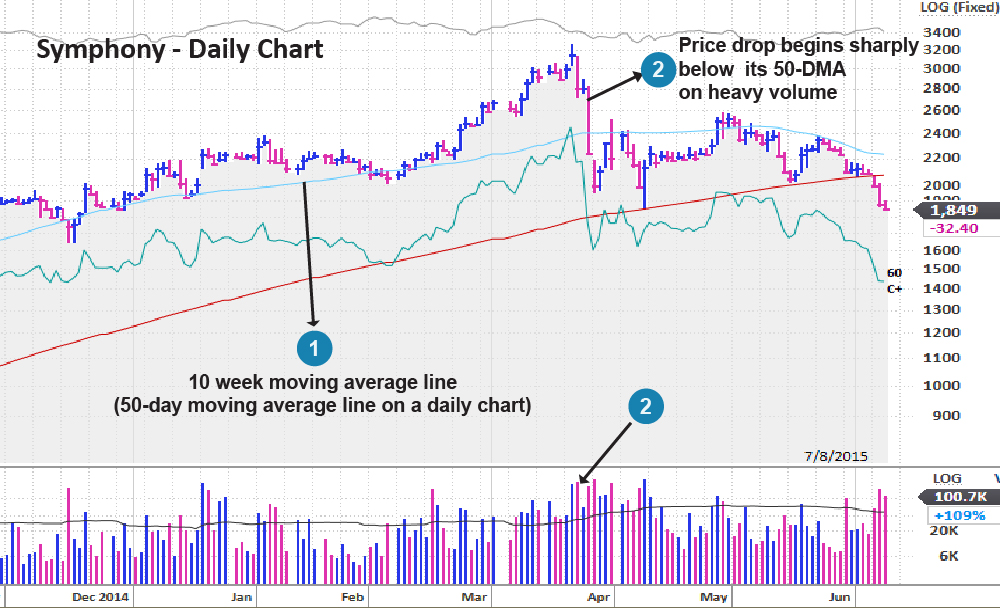
1.Heavy-volume sell-off at the 10-week line: After rising over 390% in 20 months with good support along its 10-week moving average, F5 Networks plunged below that benchmark on huge volume. It fell nearly 24% for the week on trading volumes 190% higher than normal. That marked a clear change in trend, and the stock fell over 50% from its peak in eight months
The price began to drop sharply on much heavier volume, a clear sign of institutional selling. Those warning signs appeared before the huge drop days earlier.
Support or Resistance at Specific Price Points
In addition to watching how a stock behaves around the moving average lines, you also want to look for signs of support and resistance at certain price areas. This is a vital part of understanding how and why the chart patterns discussed in the “Buying” section help you pinpoint the best time to buy a stock. And after you buy, this concept will also help you know whether you should hold the stock because it’s building stepping stones by finding support at key areas – or if it’s time to sell because it crashed right through the floor.
The following examples show you what support and resistance look like on a chart. As you look at the notes in each example, pay particular attention to that all-important relationship between price and volume.
Resistance at Key Price Points
An area of resistance is a key testing ground: Make sure the stock can punch through it on heavy volume.
Let’s take a look at Suprajit’s strength after the stock broke through key price resistance.
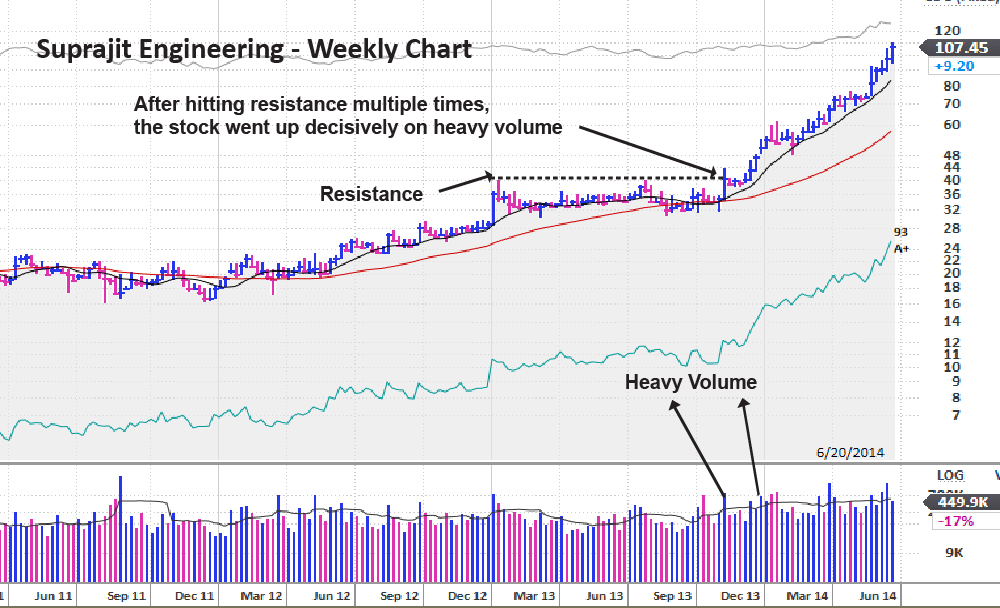
1. Resistance at same price area: Suprajit Engineering kept bumping its head around the INR 38 mark. On three separate occasions over several weeks, it hit resistance near that price point, then fell back down. Before buying, disciplined investors would wait for the stock to prove its strength by breaking through that price resistance on heavy volume. It finally did that in early November 2013, rising 16% for the week on volume 230% above average. From that breakout, Suprajit rose over 200% in less than 12 months.