At the beginning of his best-selling book, ‘How to Make Money in Stocks’, MarketSmith Founder and Chairman William J. O’Neil shows 100 charts of the top-performing stocks over the last 100+ years. Whether it was General Motors in 1915, Coca-Cola in 1934 or Priceline.com in 2006, they all built the same types of patterns.
You’ll find those same shapes today and decades from now. And by learning to spot these bases, you’ll be able to get in early on the best stocks – year after year.
Start with the three most common patterns:
- Cups: Cup-with-Handle and Cup-without-Handle
- Double Bottom
- Flat Base
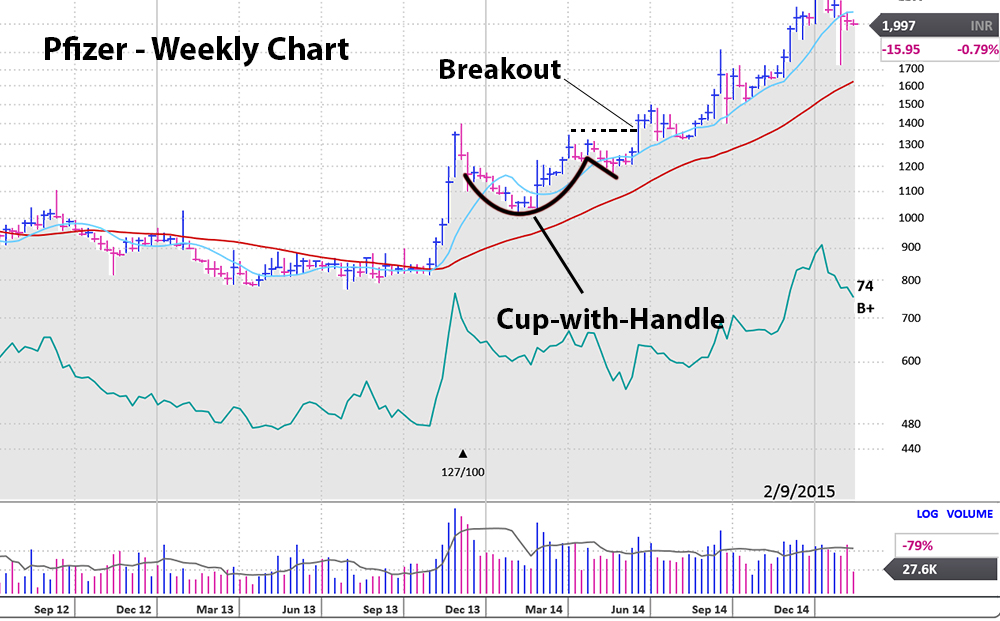
Cups: Cup-with-Handle
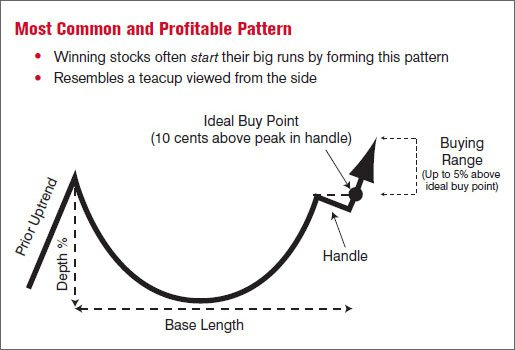
What to Look For in the Cup-with-Handle pattern.
1. Prior uptrend of at least 30%
To form a proper chart pattern, you have to have a prior uptrend. The idea behind bases is that after making a decent run, the stock begins forming stepping stones as it takes a breather and prepares for an even higher climb.
2. Base Depth: 15%-30%
The depth of the base – measured from the peak on the left side of the cup to the lowest point of the cup – should be between 15% and 30%. In a severe bear market, the depth may be 40% – 50%. As a general rule, look for stocks that held up relatively well during the market correction. So if one stock on your watch list dropped 35% while another’s base depth is only 20%, all else being equal, the stock with the 20% decline could be forming a stronger base.
3. Base length: At least 7 weeks
– The first down week in the base counts as Week #1.
The minimum length for a cup with handle is 7 weeks, but some can last much longer – several months or even a year or more. Be wary of any pattern that has the shape of a cup with handle but is only, say, 5 weeks long. That’s typically not enough time for the stock to consolidate the prior gains, and such bases have a higher chance of failing.
4. Handle:
– Volume in handle should be light – depth of the handle should be 10%-12%, should form in upper half of base. Peak of handle should be within 15% of old high on left side of cup.
The handle should be a mild pullback on relatively light volume. It’s a shakeout of weaker holders – those not committed to holding the stock longer term. A sharp decline of more than 12%-15% on heavy volume could indicate a more serious sell-off that might prevent the stock from launching a successful move.
The handle should form in the upper half of the base. If it begins forming too soon (i.e., in the lower half of the base), it could mean institutional buying, right now, is not as strong as it needs to be to push the stock higher.
Who are the weaker holders getting shaken out in the handle? Typically, they’re investors who bought late, right at the end of the prior uptrend (See Point 1, above). When the stock sold off to form the left side of the base, they suffered a sharp loss. Getting a profit is no longer their goal. They just hope to recoup some of their losses. So as the stock nears that old high – and the weaker holders’ break-even points – they start to sell.
Here’s why that shakeout is healthy: If you have a lot of weak holders in a stock, whenever the share price rises, they jump in to sell, which pushes the price back down. Once they’re out of the picture, it’s easier for the stock to move higher.
And what about the big investors who’ve been picking up shares as the stock formed the right side of the cup? They’re more committed and are holding onto their shares. That’s why the volume in the handle is light, Only the weaker holders are selling. The large institutional investors are sitting tight in expectation of a new upward climb.
5. Ideal Buy Point: 10 cents above the peak in the handle
Buying Range: Up to 5% above the ideal pivot point.
For best results, buy as close to the ideal buy point as possible. If you’re not able to watch the market during the day, you can set conditional orders ahead of time. Those trades get automatically triggered if the stock hits your target purchase price. Ask your brokerage service how to set those up.
Don’t Buy Extended Stocks
Once a stock climbs more than 5% above the pivot point, it’s considered extended or beyond the proper buying range. Stocks often pull back a bit after a breakout. So if you buy extended, there’s a higher chance you’ll get shaken out of the stock because it triggers the 7%-8% sell rule.
6. Volume on day of breakout: At least 40%-50% above average
On the day a stock breaks past its ideal buy point, volume should be at least 40%-50% higher than normal for that stock. That shows strong institutional buying. On many breakouts, you’ll see volume spike 100%, 200% or more above average. Light or below-average volume could mean the price move is just a head fake, and the stock is not quite ready for a big run.
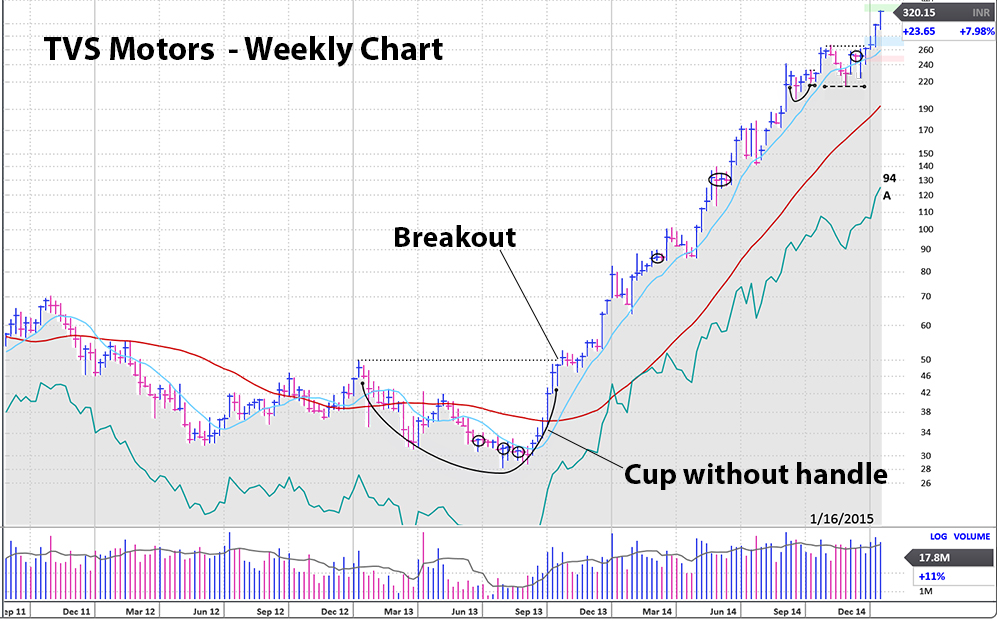
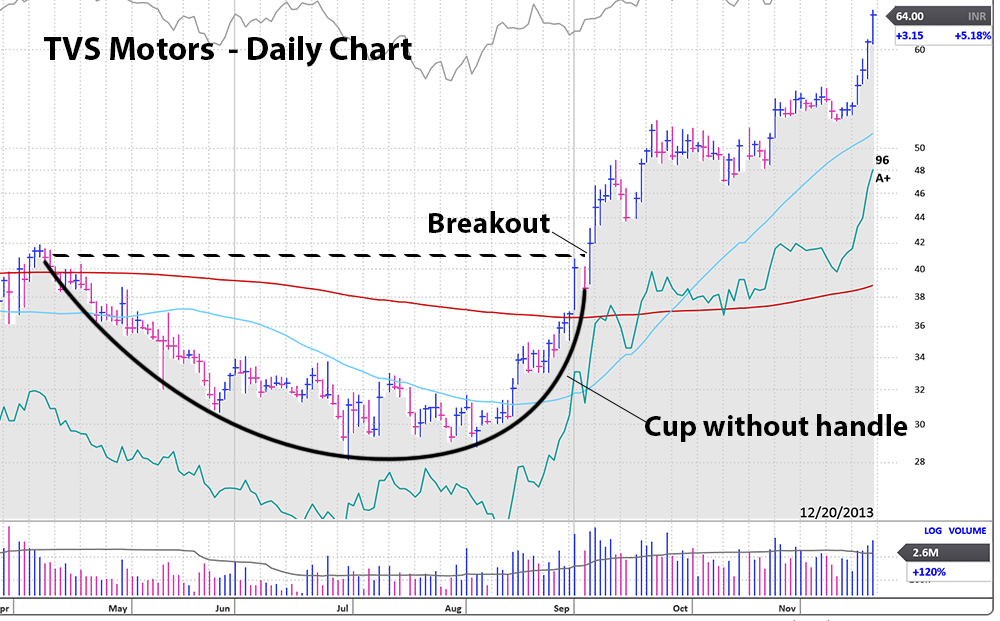
Cups: Cup-without-Handle
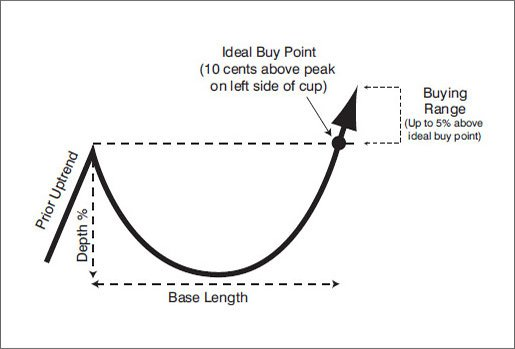
The cup-without-handle – also called a cup-shaped base or simply a cup – is a variation on the cup-with-handle pattern. As the name implies, it’s essentially the same, except it doesn’t have a handle.
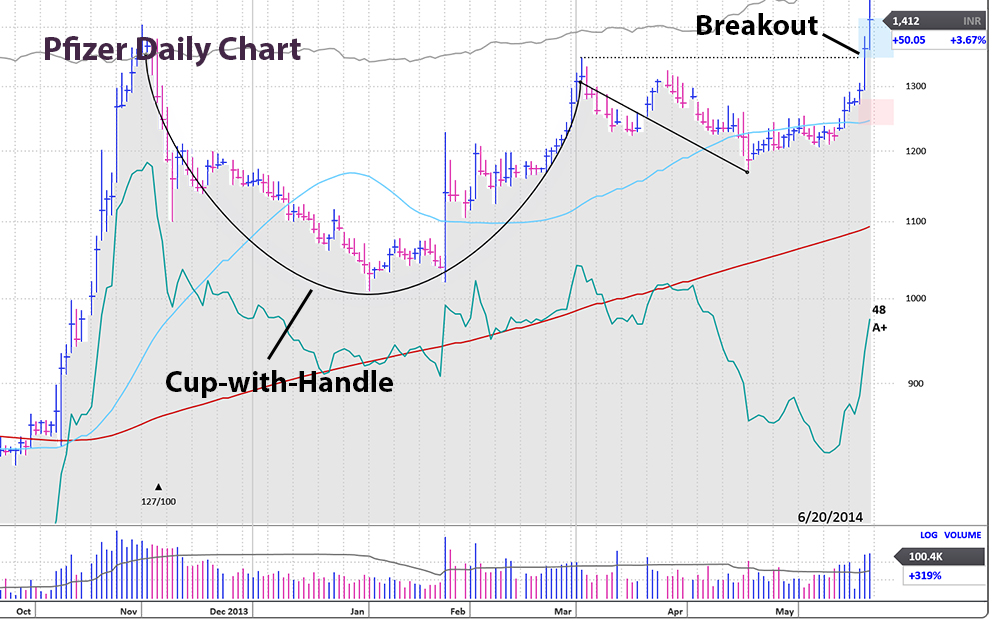
Launching Gains from the Cup-with-Handle and Cup-without-Handle Bases
Below are examples of winning stocks that launched big runs from the cup-with-handle and cup-without-handle patterns.
Both the daily and weekly charts are included. The weekly charts show the longer term trend, while the daily charts show the action on the actual day of the breakout. Be sure to use both! (See How to Read Stock Charts to learn more.)
Double Bottom
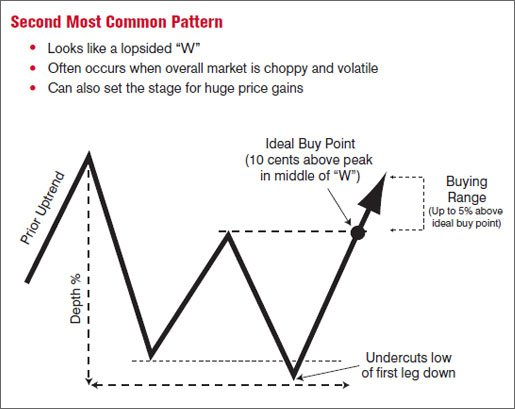
While the shape is different than a cup with handle, the core concepts and backstory of double bottoms are the same.
- Mirroring the Market: Double bottoms tend to form while the overall market is volatile, and that’s reflected in the shape. You have one down leg, then the stock tries to rally but hits resistance and ends up pulling back to form a second down leg. The stock rebounds one more time and is finally able to punch through and move higher. The breakout typically occurs when the overall market has also bounced back from a correction into a new uptrend.
- Support and Resistance: Like the cup-with-handle and all other bases, the buy point for a double bottom has to be with in 5% range from the pivot. The peak in the middle of the “W” Breaking through that resistance on unusually heavy volume shows institutional investors are back in the game, aggressively scooping up shares.
- Shakeout: Remember how the handle in the cup-with-handle shook out the weaker holders? You have the same concept here, just in a different place. Note how the bottom of the second leg in a double bottom undercuts the bottom of the first leg. That gets rid of the weaker holders, leaving more committed investors who create support for the stock’s new run.
What to Look For:
- Prior uptrend: 30% or more
- Base depth: 40% or less
- Base length: At least seven weeks. The first down week in the base counts as Week #1
- Peak in middle of “W” Should form in upper half of base and should be below left-side peak
- Undercut: Bottom of second leg down should be lower than bottom of first leg down
- Ideal buy point
- – 10 cents above the peak in the middle of the W
- – buying range: up to 5% above the ideal buy point
- – always buy as close as possible to the ideal buy point
- Volume on day of breakout: At least 40%-50% above average
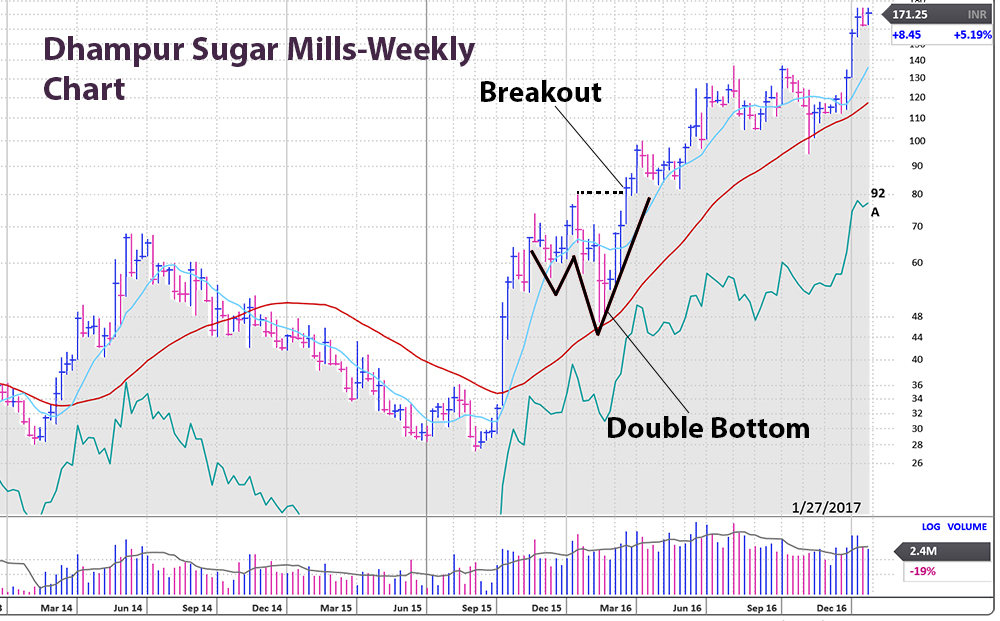
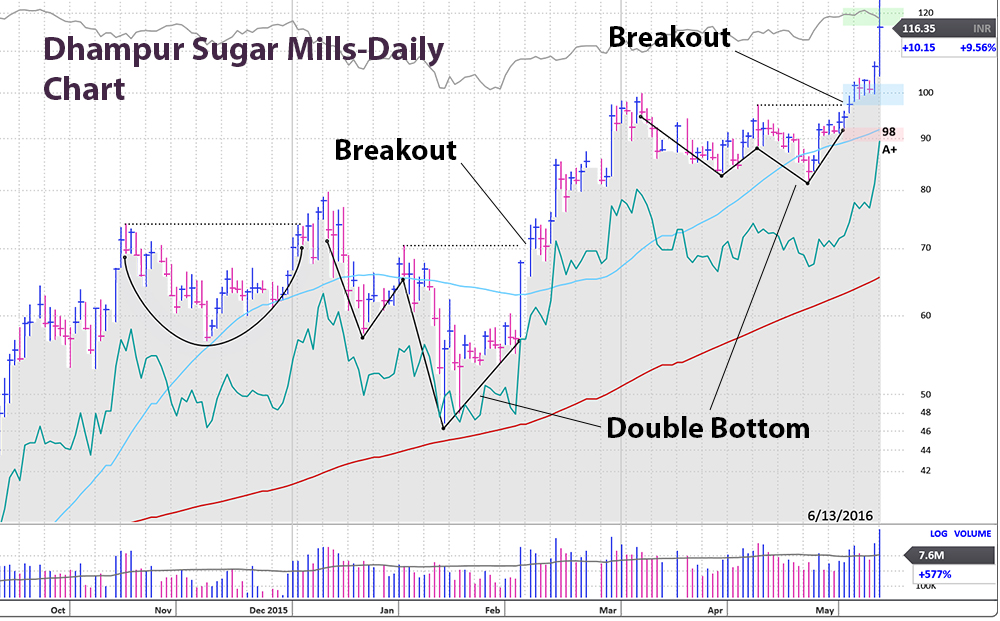
Launching Gains with the Double Bottom
Below are examples of winning stocks that launched big price runs from a double bottom pattern.
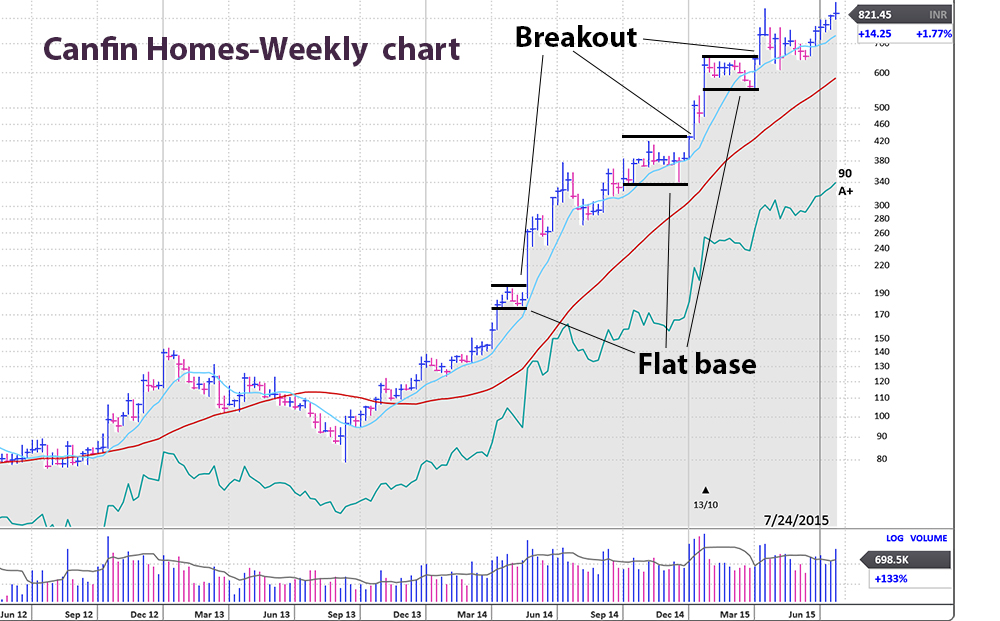
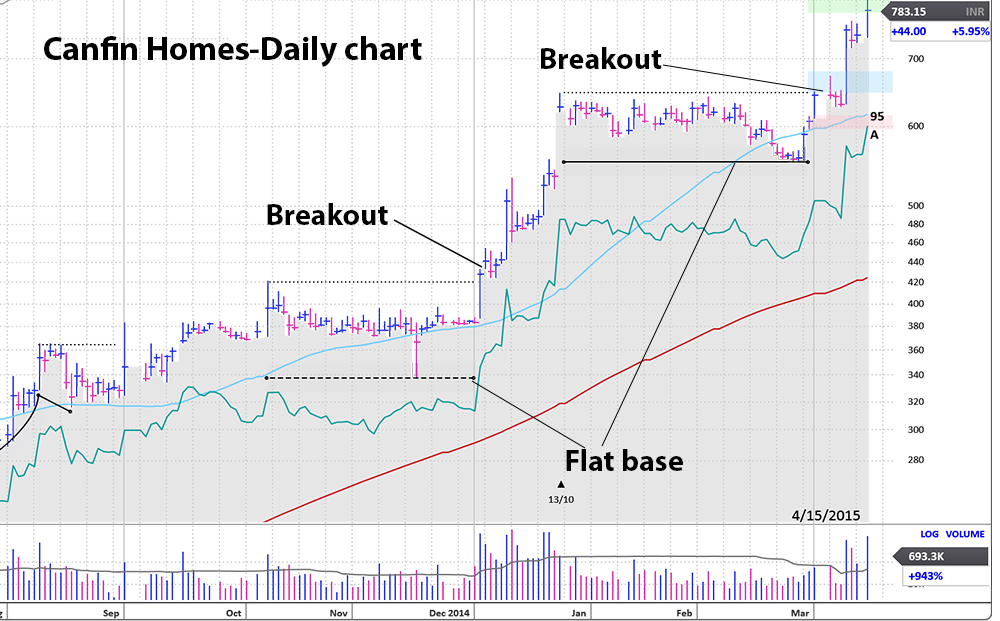
Flat Base
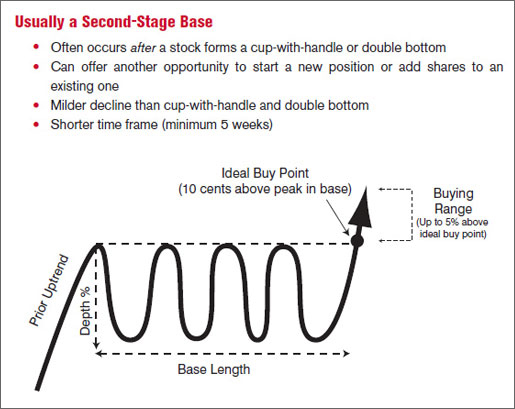
In the introduction to Bases & Buy Points, you saw how the best stocks usually form “stepping stones” as they make their big moves. They’ll go up for a while, pull back to form a new base, then resume their climb – giving you multiple opportunities to make money. The flat base is a classic example of that. They typically form after a stock has made a nice gain from a cup-with-handle or double bottom breakout. That’s why they’re often considered “second-stage” bases.
Here are the key concepts to understand about flat bases
- Trading Sideways to “Digest” Earlier Gains: Stocks will often break out of a cup-with-handle or double bottom pattern, run up at least 20%, then trade essentially sideways to form a flat base. It’s a milder decline than what you see in other patterns – no more than 15%.The price range will usually remain fairly tight throughout the base. That may mean institutional investors – who have to buy tens of thousands or more shares to establish their large positions – are quietly buying within a certain price range. That’s how they increase their holdings without significantly driving up their average cost per share.
- Support and Resistance: Here again the buy range is within 5% to the pivot point. Until the stock breaks through that “ceiling” (preferably above average volume), it won’t be able to launch the next leg of its climb.
- Shakeout: Like other patterns, flat bases also have a way of shedding weaker holders. Instead of a sharper sell-off like the handle in a cup-with-handle or the second-leg undercut in a double bottom, the flat base shakeout is more of a slow grind. The weaker, less committed investors just get worn out by the indecisive, sideways action and eventually lose patience and sell.
What to Look For:
- Prior uptrend: 30% or more
- Base depth: 15% or less
- Base length: At least 5 weeks- The first down week in the base counts as Week #1
- Ideal buy range- upto 5% above the pivot point – Always buy as close as possible to pivot point.
- Volume on day of breakout: At least 40%-50% above average
Launching Gains with the Flat Base
Below are examples of winning stocks that launched big price runs from a flat base.