
more effective it gets
Step 1: Check Current Market Direction with The Big Picture
First you should check the general market direction since trading in sync with the market is key
to your investment success. The Market Direction is displayed at the home screen of the
application just below the MarketSmith India logo. You can also learn more about the current
market direction by reading the Daily and the Weekly Big Picture, which provide a quick recap of
the daily and weekly market action.
There are four possible market conditions:
Confirmed Uptrend: This is a good time to buy fundamentally strong stocks breaking out
of proper chart bases.
Uptrend Under Pressure: This is a time to be cautious with new buys and keep a close
eye on your current holdings to make sure they are acting well. You may also consider locking in gains.
Downtrend: Making new buys in a correction is riskier since most stocks will follow the
market’s downward trend. Be sure to keep a close eye on your portfolio to make sure you’re protecting
your gains and cutting losses quickly. Use this time to look for stocks to add to your watch list so
you’re ready to take action when the market starts a new uptrend.
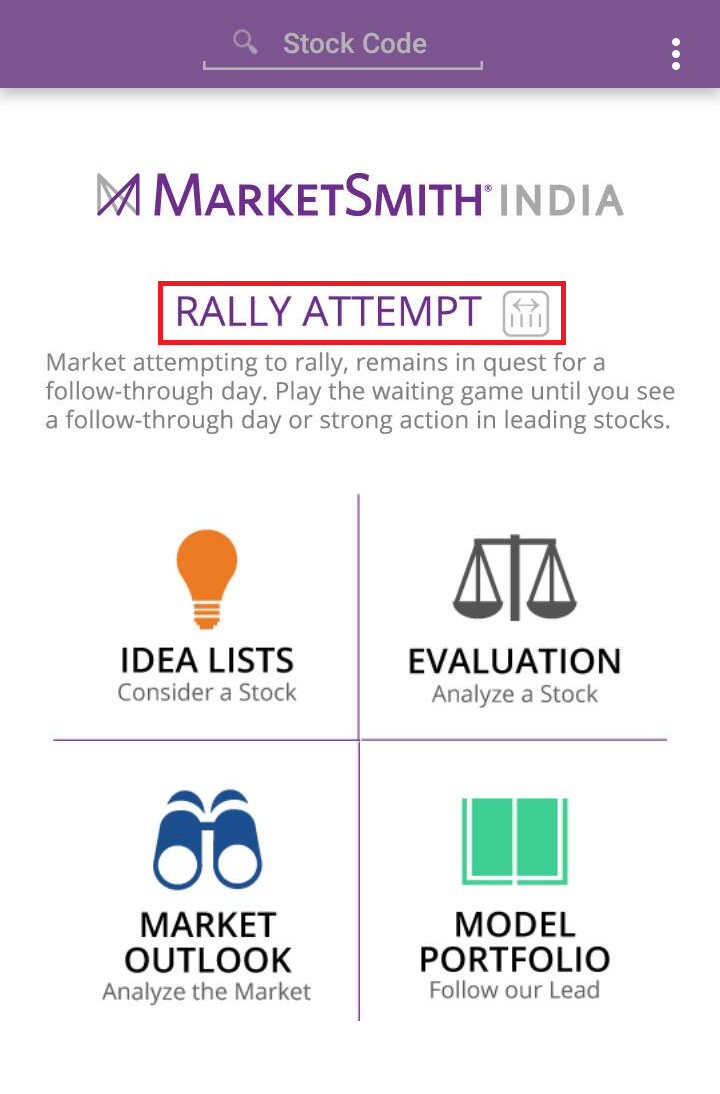
Rally Attempt: Market in a Rally Attempt remains in quest for a follow-through day,
which could mark the beginning of a potential rally. Play the waiting game until you see a
follow-through day or strong action in leading stocks.
Step 2: Find Stock Ideas Using MarketSmith India Screens
After checking the market’s trend, you will should start looking for stocks to add to your watch list.
MarketSmith India has a proprietary stock lists that streamlines your search for finding winning stocks.
MarketSmith India filters through stocks for you, so you can focus on the true leaders. Be sure to check
out these stock lists:
MarketSmith India 47: Updated on every Monday. The list highlights the top 47 growth
stocks that have top fundamental and chart characteristics.
Leaders Up on Volume: You can find leading stocks that are showing strong price action
in this list.
Leaders Down on Volume: Growth stocks can witness massive price corrections. Find out
which stocks are going down on huge volumes in this list.
Step 3: Evaluate Your Stock Ideas with MarketSmith India Proprietory Rankings
After adding stocks to your watch list, you can use some key features on the MarketSmith India app to
research the stock further.
A very popular and easy-to-use tool is the Master Score. Master Score Rating, found in the Evaluation tab
for each stock, shows you a simple overall rating combining all four of MarketSmith India’s proprietary
ratings into one comprehensive rating.
Track earnings strength with EPS Rating. Strong earnings are essential to propel a stock upward in the
market.
Price strength or Relative Strength Rating shows you which stocks are the best price performers over the
previous 12 months.
Follow the lead of large money-management institutions using the Buyer Demand Rating, also known as the
Accumulation/Distribution Rating.
Industry Group Rank grades the list of proprietary Industry Groups from 1 (best) to 197 (worst), so you
can focus on the best groups. History shows that the biggest advances come from quality stocks in the
strongest industries.
Step 4: Time Your Buying and Selling Using MarketSmith India Charts
The CAN SLIM® Investing System is unique because it combines both fundamental analysis and technical
analysis. You need to look at both to determine the strength of a stock. We use fundamental analysis
such as the stock’s earnings, sales, products, management and more to determine which stocks are true
leaders. Then we use Technical Analysis by looking at a stock chart; this helps determine the optimal
time to buy a stock and when to sell a stock.
MarketSmith India’s oversized charts make it easy to identify base patterns, buy points and sell signals.
Become familiar with chart reading to ensure that you don’t miss the next big winner! Be sure to use
both – weekly and daily charts – to get the full story.
Next Topic » The CAN SLIM® Investing
System & History