
Oftentimes, if a stock progress well, you may want to increase the holding of that stock in your portfolio. In such cases, to take a follow-up entry can be a smart move. At William O’Neil, we analyze how the best growth stocks behave soon after a strong breakout. It was observed that if a true market leader with top-notch fundamentals holds firm near a certain price level for at least three straight weeks, it can give the alert investor a chance to add shares ahead of another solid price run.
At the outset, look for base pattern formation, including the cup with handle, double bottom, flat base, and base-on-base. If the breakout is healthy, you should establish a full-size position in the stock. Generally, the follow-up buy should not be a full-size position; you may add 10–20% of your original position. If you buy the same number of shares as the first purchase, your average cost will go up dramatically. This leaves you more vulnerable to a loss if the stock pulls back to its buy point. So be happy with a small add.
One element of a good base is quiet, narrow-range trading action — both in the size of its swings from high to low, and how it closes. A stock that closes at 500 one week, 430 the next, and 490 a week later is not showing price tightness! Market players are revealing mixed views about the company’s future. This can lead to false rallies.
After a strong breakout, if shares close at nearly the same price as in prior weeks, a light bulb should shine inside your head. This behavior suggests that the overall demand for the stock is exceptionally high. If the difference between each weekly close exceeds 1.5%, the 3-weeks-tight pattern likely has flaws.
The time to add shares is when the stock climbs above the highest price in the tight pattern, ideally in strong weekly volume. You might also find a lower buy point where the stock faced an area of upward resistance. Not all 3-weeks-tight patterns work. A sudden spate of bad economic or corporate news can drown a stock in sellers. So could a major market top. Also, some 3-weeks-tight pattern stretch into 4-weeks tight.
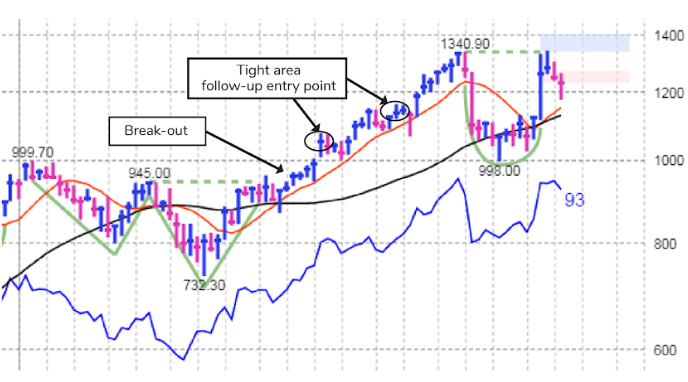
In the chart, you can see that the stock broke out of a double-bottom base. According to the O’Neil methodology, there were two follow-up entry points after the tight area formation. After both instances, the stock gave good returns.
Related:
cup-with-handle baseDouble Bottom Base
Read our last week’s article on :Exposure Management Using CANSLIM
What do you think? Please email us any questions or comments.
Disclaimer: Information contained herein is not and should not be construed as an offer, solicitation, or recommendation to buy or sell securities. It is for educational purposes only.