
Even when the market is in a Confirmed Uptrend, it is important to initiate your positions at the proper time in stock. A breakout from a base pattern is considered an ideal time to buy a stock. When markets are correcting, three out of four stocks feel the pressure. Even fundamentally strong stocks with good financial strength and growth story fail to deliver results expected of them. So, even when the market seems to be reviving, one feels inhibited to actively take positions in individual stocks. Before the situation becomes clear, all good stocks would have already rallied and what’s left is a lost opportunity.
How does one cope and find a reliable and profitable way out of this randomness? Thanks to technical analysis and historical research, there are tools that can bring some method to this madness and be beneficial.
What is a breakout?
A breakout is the key to realize your reward that you earned through patience and extensive stock selection. Almost all rallies in stocks are preceded by strong and clear breakouts. When you have selected a stock with a convincing growth story but are confused about when to make an entry so as to make profits with minimum risk, that’s when you observe the price chart closely. When a credible breakout is observed, it’s the perfect time to put your money in the stock.
A breakout is a phenomenon that a stock exhibits after making a sound base pattern (any of the five bases), indicating that it’s ready for a rally. There’s a set pivot price which is dependent on the shape and form of the base pattern (like cup-with-handle, saucer-with-handle, flat base, etc.). When the stock crosses and ends above that pivot price, it’s said to have broken out and is set for further upside.
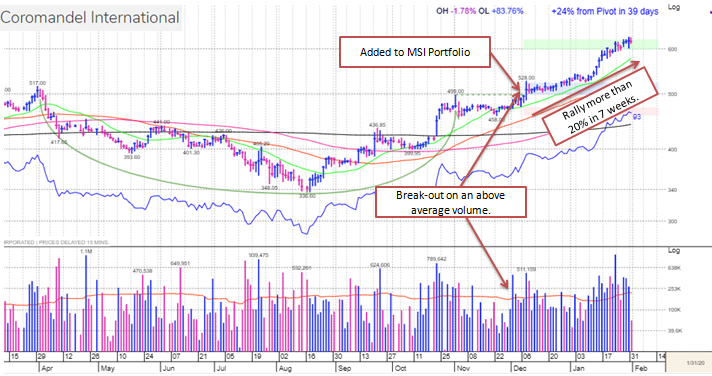
Example
Here’s an example of a successful breakout. Coromandel International formed a cup-with-handle base, as visible on the daily chart. The stock broke out of its pivot price on strong volume and progressed well. Subsequent to the breakout, the stock gave more than 20% return in seven weeks.
Signs of a good breakout
- The base pattern of the chart from which the stock is breaking out from should be convincing with its shape, depth, and price-volume action along its formation.
- Ideally, a good breakout is supported by strong volume, and is typically 40% higher than 50-day average volume. Strong volume indicates credible participation from institutional investors. Therefore, the stronger the volume is, the healthier the breakout will be.
- Strong price action is favorable in a breakout. Gap up movements (stock opening significantly above previous day’s close and maintaining the gain) and stock ending near the day’s high are good signs to see accompanying breakouts.
- A good breakout should have the support of a Confirmed Uptrend in the overall market. Breakouts in such markets have a higher chance of strong rally.
Related:
Share market basics: Overhead Supply Can Repulse A Stock’s Climb
When To Buy Growth Stocks: How Pyramiding Up Can Be As Easy As A Cup Of Coffee
How Relative Strength Rating Helps You Pick Outstanding Growth Stocks
Read our last week’s article on:Checklist to a Simple Investment Routine
To Read Detailed More Reports on Stock Recommendations, Idea Lists, Evaluate Stocks etc. Visit MarketSmith India
Disclaimer: Information contained herein is not and should not be construed as an offer, solicitation, or recommendation to buy or sell securities. It is for educational purposes only.